print function or by using a logging library such as logging or structlog.
We recommend you using structured logs for better analysis and visualization. They’re usually JSON that contain key-value pairs, making them easier to parse. The following guide will help you configure structlog to take full advantage of structured logs in Tensorlake.
Adding Structured Logs to Your Application
Using Tensorlake’s built-in application logger
The Tensorlake SDK provides a built-in application logger that outputs messages in a predefined JSON format. This logger is designed to be easy to use and provides a simple way to log messages with structured data. To initialize it, you need to import theLogger class from the tensorlake.applications module and use the get_logger method:
exc_info=True parameter:
bind() method:
Using a custom StructLog configuration
If you don’t want to use the Tensorlake’s built-in application logger, you can use structlog to add structured logs to your application. Structlog is a Python library that provides a simple and flexible way to create structured logs. To configure structlog to print JSON logs, including stack traces, we recommend using the following code:structlog.get_logger() function:
logger object inside your application. Look at this next example putting all the code together:
Setting levels for your logs
By default, when you print any information withprint in your application, we assign the level INFO to those logs.
Tensorlake supports the 5 standard levels of logging, TRACE, DEBUG, INFO, WARNING, and ERROR. These levels
are represented with numbers from Trace(1) to Error(5).
Our built-in application logger, as well as Structlog, provides helpers that will set the log level for you directly, like logger.debug and logger.warning.
To set the logging level manually, you have to print JSON objects that include a level attribute. We take the string representation of these
levels from the JSON objects and transform them into our internal representation:
Log retention
By default, all application logs are retained for 7 days. This retention period can be increased to 30 days or 1 year maximum. If you want to increase the retention period contact Tensorlake support at[email protected].
Visualizing the logs in Tensorlake’s Dashboard
The logs that you print in your applications can be visualized in each application page of the Tensorlake’s Dashboard. That page allows you to filter logs by different parameters, like request IDs, function names, and logging levels.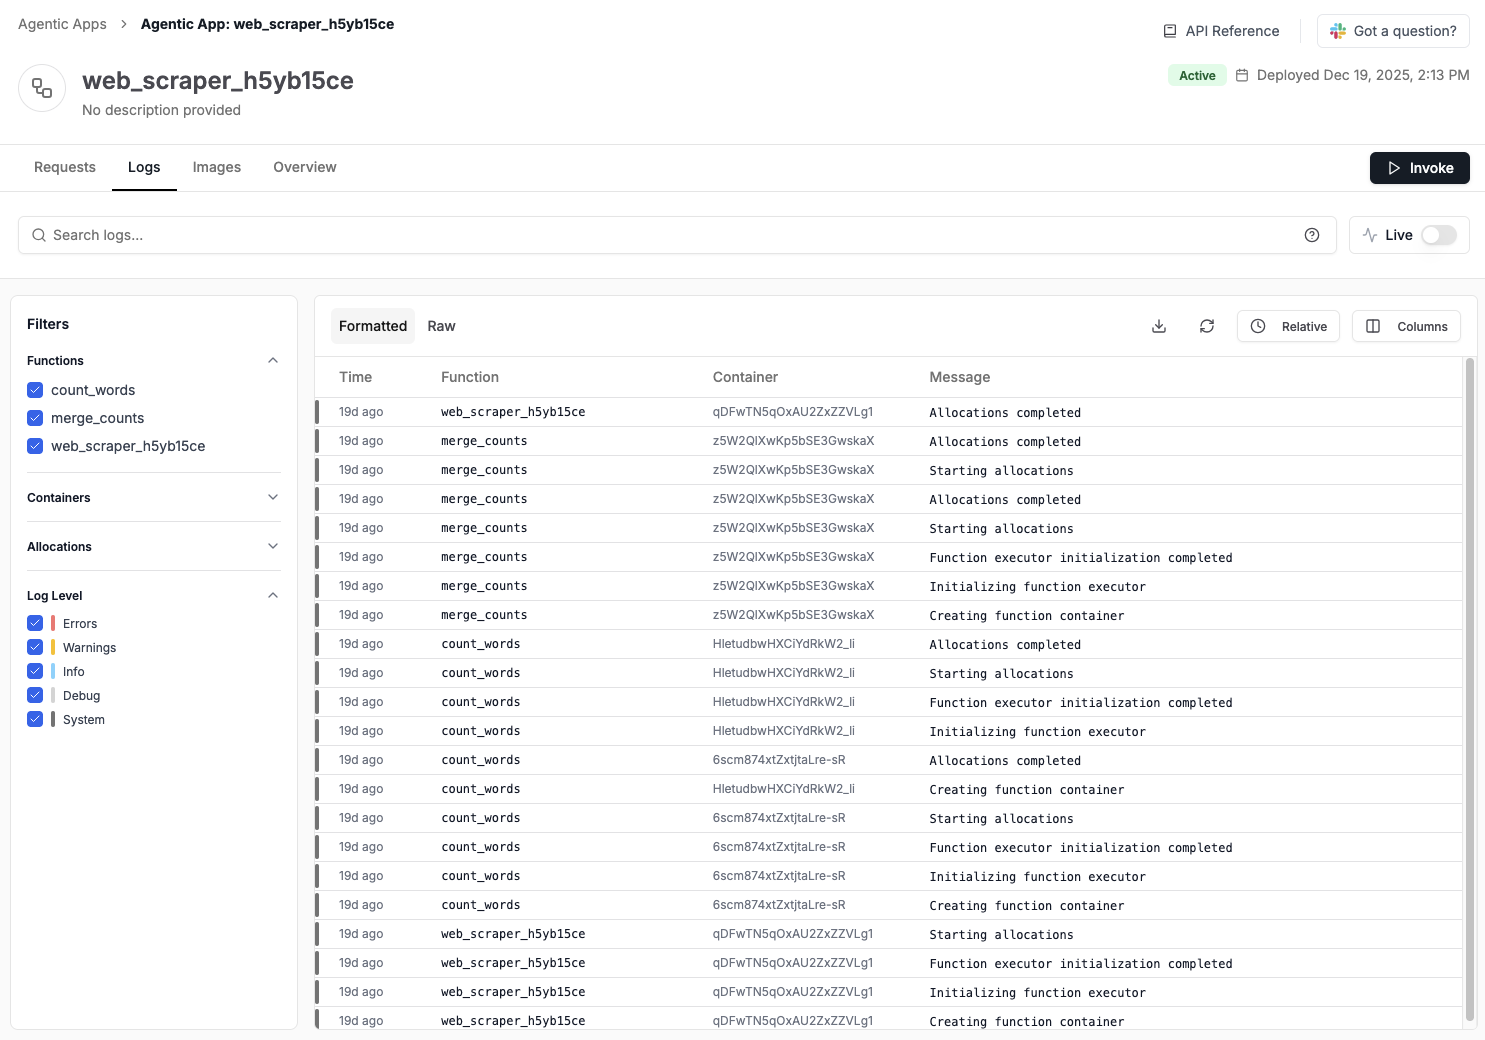
Get Application logs via API
Application logs are also accessible via the Tensorlake API. You can usecurl or any other HTTP client to retrieve logs for your application. The following section explains how to do that:
Filtering Logs
You can filter logs using query parameters to narrow down results: Filter by Request IDevents if you want to filter out system events:
- Trace
- Debug
- Info
- Warning
- Error
gate parameter to combine multiple filters with AND (default) or OR logic:
Pagination and Ordering
Get Most Recent Logs (Default) By default, logs are returned in descending order (newest first). Usetail to specify the number of logs:
head to get logs in ascending order (oldest first):
nextToken from the response to fetch the next page:
Query Parameters Reference
| Parameter | Type | Description |
|---|---|---|
requestId | String | Filter logs for specific request IDs |
function | String | Filter logs for specific function names |
functionExecutor | String | Filter logs for specific function executor containers |
functionRunId | String | Filter logs for specific function runs |
allocationId | String | Filter logs for specific allocations |
level | Integer | Filter logs for specific log levels |
events | Integer | Filter system and application events |
gate | and | or | Logic for combining multiple filters (default: and) |
head | Integer | Number of logs to return in ascending order (default: 100) |
tail | Integer | Number of logs to return in descending order (default: 100) |
nextToken | String | Pagination token from previous response |
gate parameter as connector.
For example, filtering DEBUG and INFO logs: